Your Attribution Report Is Taking Credit for Sales You’d Have Made Anyway
The scientific method made direct marketing the most accountable discipline in the building. Attribution dashboards quietly let it slip...
Contents
I’ve seen this movie before.
In the catalog business, nobody trusted a response rate on its own. Before a circulation plan went to the printer, someone asked the question that kept the business honest: what would these customers have bought if we hadn’t mailed them?
We answered it the hard way. Test cells. Holdout panels. Matchback reports. It was slow, unglamorous work, and it’s the reason direct marketing earned its reputation for accountability.
Then the dashboards arrived.
Today every channel ships with a report showing how much revenue it produced. Email claims the order. Paid search claims the order. Retargeting claims the order. Add up the claims and you’ve often sold more than you actually sold.
Those reports aren’t lying. They’re answering a different question from the one you need answered.
I’ve planned circulation for 40 million catalogs a year, moved 44% of a company’s sales to the web, built marketing databases since the 1990s, and spoken at DMA conferences on lifetime value and segmentation. So take this from someone who has actually run the business:
“A report tells you who got the credit. Only a test tells you what you caused.”
Don’t measure this by next quarter’s dashboard. Ask where your marketing budget sits three to five years from now if every dollar keeps flowing to the channel that’s best at claiming sales. Then ask where it sits if the money follows the channels that actually create them.
Here are the four lessons that separate the two.
Lesson One: Start with a question, not a report
The scientific method is the oldest playbook in direct marketing. Ask. Hypothesize. Test. Measure. Learn. Improve. Then do it again.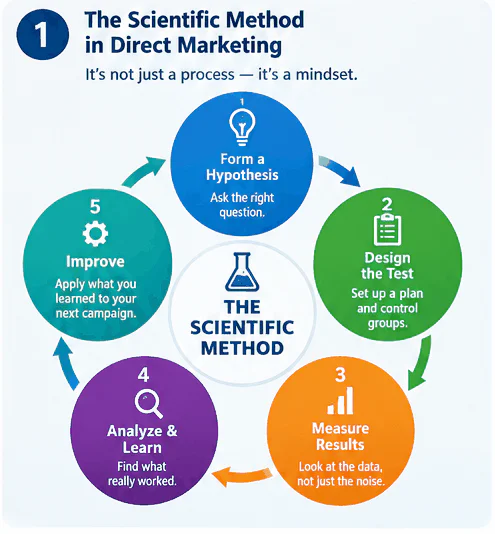
Figure 1. The scientific method is a repeatable learning cycle.
Most teams skip the first step. They start with a report and work backward to a conclusion.
Consider two questions that sound almost identical:
Which email generated the most revenue?
Does sending this email increase total purchases compared with not sending it?
Your email platform answers the first one every morning. It can’t answer the second one at all, because that requires knowing what happened to the people who didn’t get the email.
That’s the whole game. Testing two subject lines is useful work, but it’s testing routinely, not testing rigorously. Rigor starts with a hypothesis written down before anything goes out:
A catalog plus an email will produce more incremental profit than the catalog alone.
Free shipping will produce more contribution margin than 15% off.
Cutting promotional frequency will lower costs without materially reducing purchases.
A hypothesis forces you to say what you expect to change and how you’ll know whether it mattered. The goal isn’t to prove your latest idea right. It’s to find out what actually works.
Lesson Two: Credit is not cause
Here’s a customer journey you’ll recognize. A catalog lands. A few days later she searches your company name, clicks the paid ad, browses, gets an email, and orders.
Figure 2. Attribution allocates credit across touchpoints; incrementality asks which sales the marketing actually created.
Who gets the credit?
That depends on the attribution model: last click, first touch, a split, or an algorithm’s best guess. Each tells you something. None of them proves the marketing caused the sale. The catalog may have prompted it. The ad may have helped her find you. Or she’s bought from you for ten years and was going to reorder no matter what.
That’s the difference between two words that get used interchangeably and shouldn’t be:
Attribution divides up the credit for sales that happened.
Incrementality counts the sales that happened because of the marketing.
The gap between them is widest exactly where money is easiest to spend: loyal customers, branded search, retargeting, promotional email, and mail to people who already know you.
The most famous proof came from eBay. Its economists switched off paid ads on eBay’s own brand name and watched what happened. 99.5% of the lost click traffic came straight back through the free search listings. The ads had been claiming credit for customers who were arriving anyway. (Blake, Nosko and Tadelis, Econometrica, 2015.)
That’s not villainy. It’s an unforced error. It also works in reverse: a channel that rarely gets the last click may be doing heavy lifting that no report will ever show you.
The answer isn’t to throw out attribution. It’s to stop treating it as proof.
Lesson Three: Do the math on the holdout
Here’s a simplified example. The numbers are illustrative, but the arithmetic is real.
You mail a promotion to 10,000 customers and get 500 orders, a 5% response rate. The report says the campaign drove 500 orders.
Now suppose you held back a random group of comparable customers who got nothing, and they ordered at 3% during the same window.
What the promotion actually produced
Three hundred of those orders were coming in the door regardless. The promotion earned two points of response, not five.
Now put a P&L on it. Assume the piece costs $0.80 in the mail and each order contributes $40 after cost of goods and fulfillment. These are assumptions, so plug in your own.
Same campaign, two scorecards
Same campaign, same mail drop. One scorecard says repeat it and add volume. The other says it barely paid its postage.
Multiply that gap across every program you run in a year and you see why this matters. Budget, contact frequency, channel mix and the offer itself all shift once you know which sales you caused.
A rule I live by
Never judge a campaign by the orders it received. Judge it by the orders it created.
If you don’t have a control group, admit you don’t know which is which.
Lesson Four: Test the details with A/B. Test the program with a holdout.
These are two tools for two different jobs, and confusing them is one of the most common mistakes I see.
Figure 3. A/B tests compare campaign alternatives; holdout tests compare marketing exposure with a control.
An A/B test answers which version works better? Two headlines, two offers, two formats, two landing pages: split a random audience and run them at the same time.
A holdout test answers does this program add anything at all? Randomly withhold the campaign from part of the eligible audience, say 10% of your list for one promotional email. After a full buying cycle, compare purchases, revenue per customer and contribution profit between the two groups. If they look the same, the email is mostly taking credit, whatever the platform report says.
The same principle works for catalogs, paid media and contact strategy. When randomizing individuals isn’t practical, hold out whole markets: matched geographies that don’t get the campaign.
The disciplines that make either test trustworthy:
Change one thing. Change the headline, offer, format and audience at once, and you’ll learn which version won without learning why.
Measure what the business cares about. Opens and clicks diagnose. Orders, contribution margin and lifetime value decide.
Set sample size and duration before you start. Small samples and short windows produce confident nonsense.
Don’t stop when you’re ahead. Peeking daily and calling the test the moment your favorite leads is how false signals get funded.
Write it down. Record the hypothesis, audience, design, result, limitations and decision. Over time that log becomes institutional memory instead of a pile of campaign reports.
Yes, a holdout costs you some sales during the test. Weigh that against knowing whether a program you’ll run fifty more times is actually profitable. You don’t need to test everything. Test the decisions where better evidence changes the money.
A word to the next generation
The tools change every few years. The ability to design a fair test never goes out of style.
Learn to write a hypothesis, pick a control group, and read a result honestly, including the results you didn’t want. The people who can do that end up running the budget.
Your next step
Pick one program whose real contribution you’re unsure of: branded search, a promotional email series, a retargeting campaign.
Write the hypothesis. Hold out 10% at random. Agree on the success metric and the measurement window before launch. Then act on what you find.
If I Sat on Your Board: The question I’d ask
The biggest obstacle isn’t technology. It’s habit. Reporting systems are built to show what happened, not what caused it, and nobody enjoys learning that a long-standing program isn’t pulling its weight.
Figure 4. The return compounds: less waste, better profitability, assumptions challenged, opportunities found.
But every honest test pays off in one of three ways. It confirms that something works, so you can fund it with confidence. It exposes something that doesn’t, so you can stop. Or it uncovers an opportunity your reports were hiding. All three are worth the price of the test.
So look at the marketing budget and ask your team:
Of the sales our marketing gets credit for, how many would we have made anyway?
If nobody can answer with a control group behind it, you’re steering by the dashboard instead of the road.
Direct marketing has always had the edge of connecting what we do to what customers buy. The scientific method is how we keep it. You’re not behind. You just need to start testing again.
Figure 5. Five steps to put the method back to work.
Measure what your marketing creates. I’m glad to help you get there.
About the author
Gary Q. Smith — President, GQS Direct, LLC
Gary pairs four decades of P&L-accountable direct marketing leadership with practitioner-level command of today’s commerce stack. He is currently an AI evangelist and practitioner and has led four e-commerce website implementations and integrations, built marketing databases, was architect and project leader for a custom ERP system, and managed omnichannel marketing strategy and communications for several businesses.
Most consultants have studied these problems. GQS Direct has owned them.
Start with a complimentary consultation →